In today’s connected world, more and more people are reliant on digital tools1 for their daily tasks in nearly all facets of work. This includes communication tools like email and Slack, project management tools like JIRA, and collaborative tools like the Office 365 not to mention individual productivity.
In most organizations, thousands of these small interactions or sessions occur across a variety of these digital platforms in a given work day. As a result, within each of these digital tools lies a mountain of information on how organization functions, how work gets done and what the day-to-day experience of employees is like.
Using a variety of techniques it is possible to responsibly and ethically analyze this data and gather invaluable insights to help make better business decisions and improve employee experience. One of the most popular new techniques for the analysis of this data is: “Organizational Network Analysis (ONA)”.
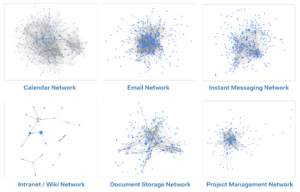
Below examples of various networks from in a single organization
What is ONA?
ONA is essentially the analysis of networks of relationships and how information flows within an organization. Data from IT tools is analyzed to showcase how different teams in a given organization communicate and collaborate. For example, one can look at calendar data showing the volume of meetings to determine how much and which parts of an organization are working together closely. This data not only shows how information travels in an organization but also the strength of relationships between different groups. If three different teams need to be in communication for a project, but the bulk of information transfer is only happening between two, there may be a divide that needs to be addressed.
ONA has grown significantly in popularity over the last few years. Experts like Josh Bersin have labeled it as a major disruptor for HR in 20202 and beyond. The excitement is easy to understand. From our communications with HR leaders, they find it appealing to finally be able to understand employee behaviors, as well as how they contribute to business outcomes. If utilized properly, ONA has massive potential across the board.
Ethical Use of Data
Some of the concerns when working with this type of data, as it is for just about any data-based initiative in 2020, are ethics3 and implications to end-user privacy. Finding an ethical way to perform ONA is not just important for employee buy-in, but also may be a matter of regulatory compliance as the laws on data continue to evolve. There are a few key items of focus that will ensure an ethical take on ONA:
Transparency: Employees shouldn’t be in the dark that their communications are going to be analyzed in such a manner, so explain the benefit to them and the organization.
Use aggregation to provide anonymity: One way we maintain privacy is to ensure that all data analysis occurs at the group level, thereby pseudo-anonymizing any data.
Emphasize metadata over content: We also focus more on when work took place and what teams are involved rather than any specific content. All of this information is available in metadata only and does not require access or any analysis of content.
More than just pretty pictures
When first experimenting with ONA, many people tend to be drawn to the amazing visuals you see in a typical network chart. When we talk to different organizations about the possibilities of ONA, this is generally the first thing they want to see: what the network diagram looks like and what insights it can provide.
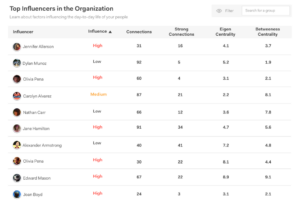
However, in reality, it’s not easy to get useful insights from only a network diagram. The larger the organization, the harder this gets, as you could be looking at thousands of different employees and connections. A leading practice is to avoid this type of visual interpretation and focus more on network metrics and mathematical models to look at parameters of the network and included groups. As an example, we would focus on how connected your average manager is with their team. Using IT metadata, we would see how much of their time is spent on collaboration and whether their leadership style is heavily involved or more hands-off.
The image below shows a list of how connected and influential managers are within an organization. We find this is far more insightful than an image of the network itself.
Tying Data to Outcomes
To get to valuable insight one needs to go beyond just looking at the raw data and metrics on interaction. Using that last example, it’s nice to know how your managers interact with their teams, but how do you determine whether their behavior is positive or harmful? To answer that question, you need to establish links between these types of behaviors and relevant business outcomes. There are a wide variety of outcomes you can look at, including:
- Engagement survey results
- Rates of employee attrition
- Sales target completion
- Revenue
- Customer satisfaction ratings
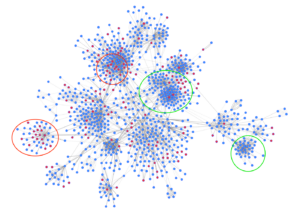
Going back to managers and their interactions with teams, how can the figures below be used to gain insight on team engagement? To make that connection, one can try and analyze the linkage between management interaction style with a team and general survey outcomes. You can see different teams with different management styles based on IT metadata, then see how that correlates with teams that rate themselves as highly engaged.
Example: Using network data to identify hotspots of low morale within an org.
ONA/IT Data in Action
To give you a better sense of typical use cases for behavioral data and ONA we’ve summarized two case studies below:
- Case Study: Analyzing Work Schedule
We were approached by an organization in the technology sector with a large workforce of software engineers and supporting roles. They were dealing with significant project delays and attrition due to low morale. Employees that did provide feedback said that it was difficult to complete objectives due to work being a “chaotic, high-pressure” environment.
We know from prior experience that knowledge workers, such as engineers, require long periods of uninterrupted time in order to do the deep problem-solving that is a key part of their work. Ideally, they need 2 hours of uninterrupted time to complete objectives. To help better understand these dynamics we focused on using IT metadata to look at how teams were collaborating, including the share of time allocated between individual-focused work and general collaboration in the daily schedule.
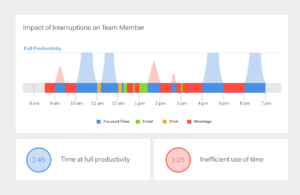
By analyzing their data, we identified a slew of interruptions in the typical workday of most engineers, largely driven by emails, meetings, and chat messages (Slack, etc.). Employees were typically at work for 9 hours, but only had as little as 2 to 3 hours a day for focused work due to these interruptions. Schedule data showed that many teams and engineers had extremely long workdays, approximately 10 hours or more. When we took a closer look, we discovered a work pattern that was driving burnout. In a high-pressure environment, people work harder to succeed. However, due to interruptions during the day, they have to work in the evening to play catchup.
Example of how we analyzed the typical work schedule and the impact of interruptions from email, chat and meetings on people’s ability to do individual focused work.
We followed up with a network analysis to figure out exactly where these interruptions stemmed from. What we found was a massive amount of emails and chat messages coming from customer support teams to the engineers. We discovered that the support team (and by proxy, customers) had direct access to the engineering team. This meant that hundreds of un-prioritized requests were coming through informal channels. When we presented this data to the client, the team mentioned that they suspected this was what was going on, but a concrete, data-based explanation was what it took for management to understand it.
As a result of these findings, the organization put together formal channels between customer service and engineering and also installed ticket management software to help prioritize requests. Lastly, they used a single point of contact between the two departments. The project manager would now serve as a communication buffer between engineering and customer service.
These measures drove a significant improvement in business outcomes. Follow-up data showed an increase in focus time for engineers. This increased from an average of 2.5 hours a day to 4.5. A follow-up survey on employee satisfaction showed that teams were happier across the board. In addition, attrition also dropped, and no drops in customer satisfaction were reported.
Case Study: COVID-19 WFH Analysis
Another relevant example of the use of IT metadata is in understanding the impact of major transformations within an organization. The COVID-19 pandemic has driven millions of workers4 to work from home in a matter of weeks. For many organizations it’s not exactly clear how well their teams are adapting to this major new change. Business leaders are concerned about employee wellbeing, falling productivity or lower levels of collaboration as teams have suddenly had to go all digital.
IT metadata serves as a fantastic tool to determine the impact of this enormous shift on work patterns and how organizations are moving to adapt to the change. We’ve been inundated with requests for analysis and detailed insight into the impact of this transition. There are several interesting trends that we’ve seen so far in this area:
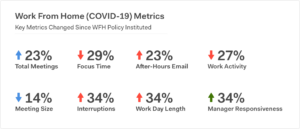
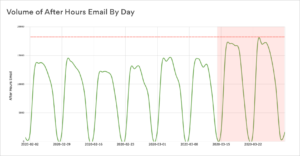
Increased after-hours work: On average, the workday length increased by 34% since WFH policies were implemented. Some may attribute this to remote workers no longer needing to commute, but we also note that there has been a steady increase in after-hours emails as well. Our theory is that the increased blending of work and personal lives is causing more employees to do work after hours to make up for lost time during the day.
Increases in meetings, email, and chat: This, on the surface, isn’t too surprising, as communications that would normally be handled in person now have to be done digitally. However, we also note that average meeting sizes have dropped by 14%. This suggests that not only are formal communications going digital, but some of the informal conversations may be as well.
Increased collaboration: Perhaps due to needing to catch up on projects that fell behind in the onset of the pandemic, we saw a surge in collaboration early on. However, that is dropping incrementally over time. Some of this may just be due to adapting in a new normal, but in other cases, it may be a matter of “out of sight, out of mind.” Organizations need to be mindful of this to avoid employee isolation and poor information flow.
Along with these results, we’ve also worked on putting together a work-from-home checklist, using ONA and other techniques for more analysis on how well organizations are adapting. This is a great example of the value of IT metadata, as it allows organizations to adapt to changes by seeing their impact in real-time. During a rapid change this can be far more useful than more delayed signals, like employee surveys. Organizations that use this for COVID-19 and have employees working from home can better implement training and policy that will allow their workforces to return to some level of normalcy.
Examples of some early metrics we’ve seen change:
More after-hours email
The Age of Behavioral Analytics
Behavioral analytics, such as those derived from ONA, are set to change how we analyze and conduct business across the board. We now have access to an incredibly valuable new dataset and the techniques to extract insights from it. Armed with this data, organizations are in a position to make more informed decisions on people and process, and to react to changes as they play out.
As always, it’s critical that these analyses are connected to business outcomes to inform action. Equally important is being mindful of ethics and transparency when using these methods. However, these are conversations worth having. As we see more and more uncertainty and change, concrete data becomes even more essential. Now more than ever, organizations need these insights to better understand their employee experience and inform their decisions.
References
1: https://deloitte.wsj.com/cio/2017/06/21/digital-tools-a-boon-to-small-businesses/
4: https://www.cio.com/article/3532812/covid-19s-impact-on-the-enterprise-and-remote-work.html